Sign-Off (EDI, EPS, Primetime)
Author: Hetaswi Vankani, Adithya Venkatramanan, Dr. Dong S. Ha
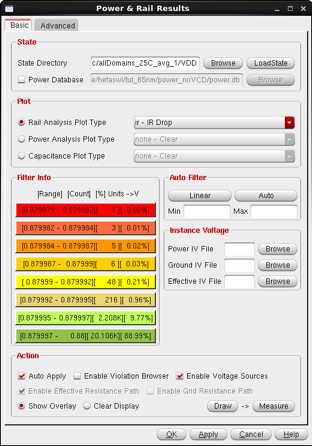
n. Rail Analysis – view Results
i. Power & Rail → Power & Rail Results
ii. State Directory: Select ./rail_result/allDoamins_25C_avg_1/VDD. Then, hit LoadState
iii. Plot: Rail Analysis Plot Type. Select: ir – IR Drop
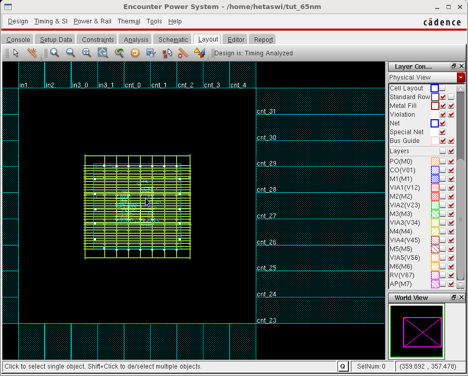
If you zoom into the layout and click on the red region, you will notice that the IR drop is high for count_reg_21_. Type:
report_power –instance count_reg_21_ and
report_power –instance count_reg_1_
While reg_1 has a yellow shade (low IR drop), reg_31 has a red color associated with it on the IR drop plot. On analyzing the power consumption of the regions, we note that the switching power is high for the net connecting reg_31. This explains the relatively higher IR drop.
o. Final check:
- As a check on whether IR drop is clear or not check:
- ./rail_result/allDomains_25C_avg_1/VDD/results
- ./rail_result/allDomains_25C_avg_1/VSS/results
- IR drop limit and linear filters should read ‘PASSED’ in those files.
p. GDSII streamOut using encounter.
i. Having cleared all checks – DRC, timing, power and IR drop, one can streamOut GDSII
- streamOut updown_counter.gds -mapFile ./libs/gds2.map -merge
- {/software/PDK/65nm_TSMC/Mosis_Doc/65nmLibs/tcbn65gplus/tcbn65gplus_backendzipped/tcbn65gplus_140a_gds/
- TSMCHOME/digital/Back_End/gds/tcbn65gplus_140a/tcbn65gplus.gds
- /software/PDK/65nm_TSMC/Mosis_Doc/65nmLibs/tpdn65gpgv2od3_sd/tpdn65gpgv2od3_sd/
- tpdn65gpgv2od3_sd_200a_gdsu6lm/TSMCHOME/digital/Back_End/gds/tpdn65gpgv2od3_sd_200a/mt_2/6lm/tpdn65gpgv2od3_sd.gds}
MICS IAP Members