Front End Design Using Synopsys Tools - Part 3
Author: Hetaswi Vankani, Dr. Dong S. Ha
Tool: Library Compiler, VCS and DVE
NOTE: The files downloaded must not be saved or used in .txt format. Please save it in the format as mentioned in the tutorial.
Simulate and Analyze Waveform
1. Type simv
2. Check if ‘updown_counter.dump’ is generated. If not check the testbench.
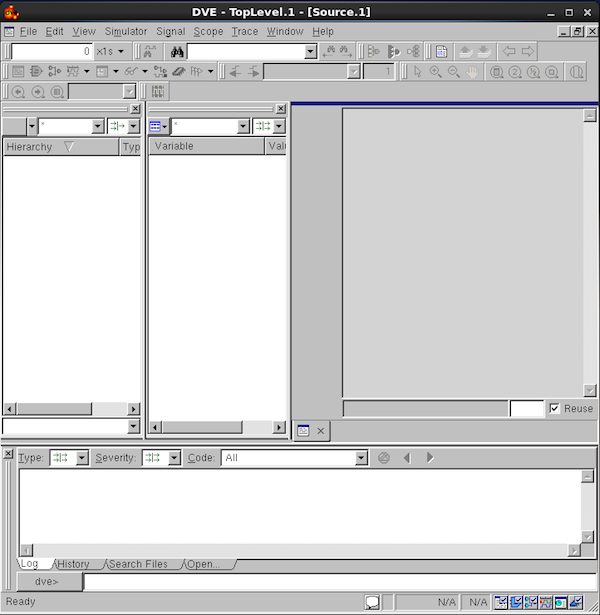
3. Next step is to observe the .dump file in the waveform window. Make sure that ‘[Synopsys_New]’ appears in the prompt. If not, type ‘Synopsys_New’. Synopsys’ Discovery Visualization Environment (DVE) will be used to trace signals. Type ‘dve’.
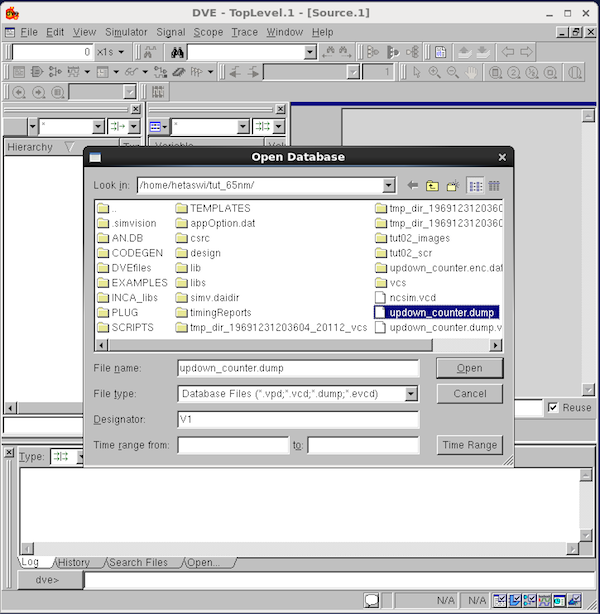
4. File → Open Database → Select ‘updown_counter.dump’ → Hit ‘Open’
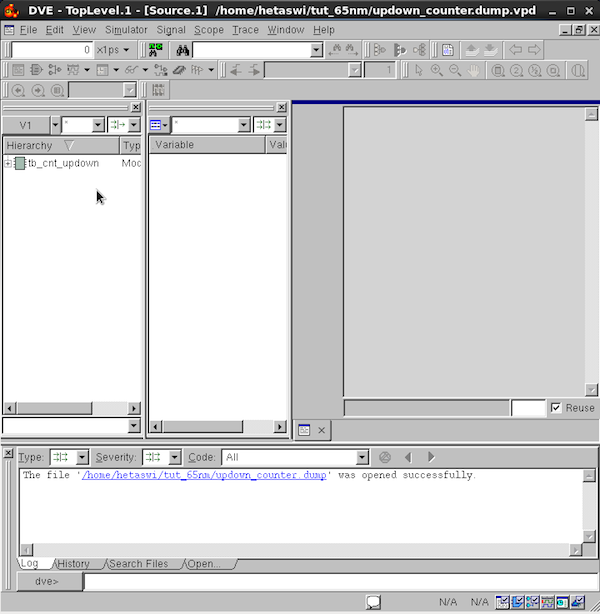
5. Select the design ‘tb_cnt_updown’ in the hierarchy window, to display the input and output signals.
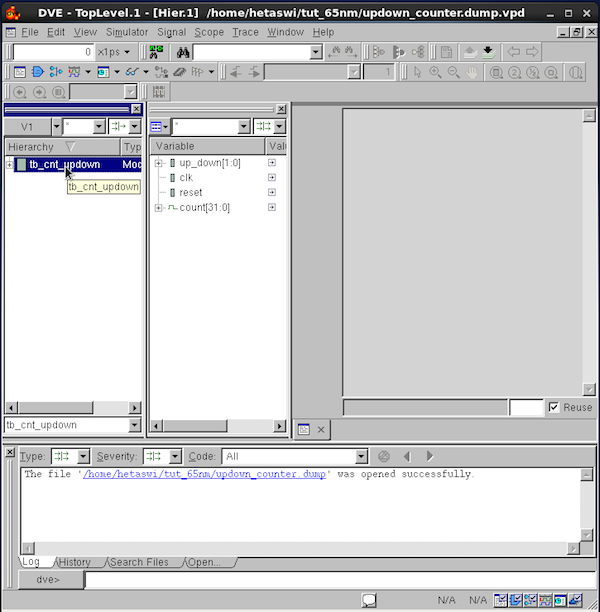
6. Select the signals in the variable window. Next in the GUI follow the steps: Signal → ‘Add To Waves New Wave View’
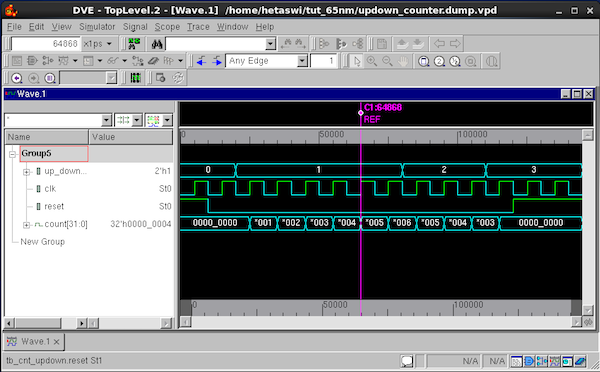
7. A waveform window as shown below will appear:
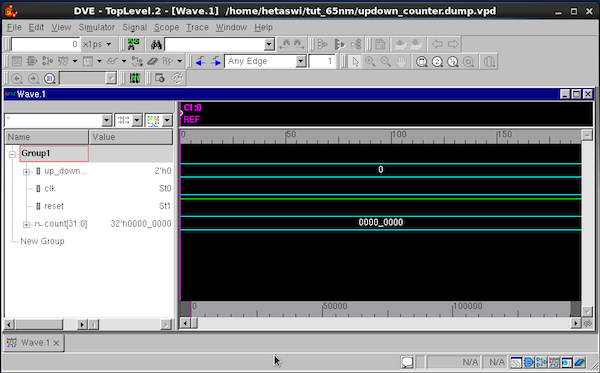
8. In the waveform window, View → Zoom → Zoom full

MICS IAP Members