Front End Design Using Cadence Tool - Analyze and Compile
Authors: Hetaswi Vankani, Adithya Venkatramanan,and Dr. Dong S. Ha
2. Simulate and Analyze Waveform
A. SimVision – This is the Cadence tool used to analyze the waveform.
i. Type ‘simvision’ in the command prompt. Make sure that the Cadence tools path are set. If not, first set paths by typing Cadence.
ii. Once the tool is invoked, a GUI as shown in fig. 5 will appear:
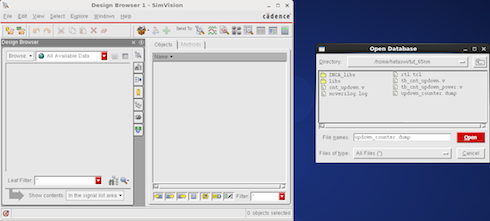
a. Select File → Open Database
b. Make sure ‘Files of type: All Files (*)’ is selected so that .dump file is visible.
c. Select updown_counter.dump and hit ‘open’
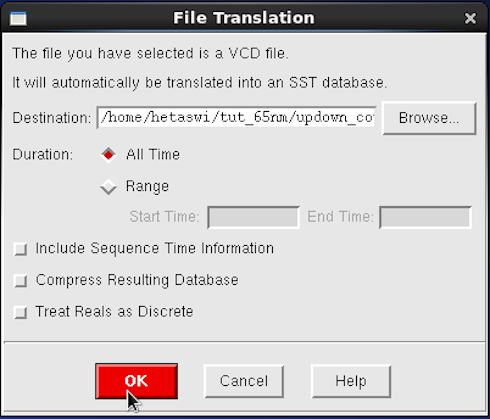
iii. Next a file translation window would open. Hit ‘OK’
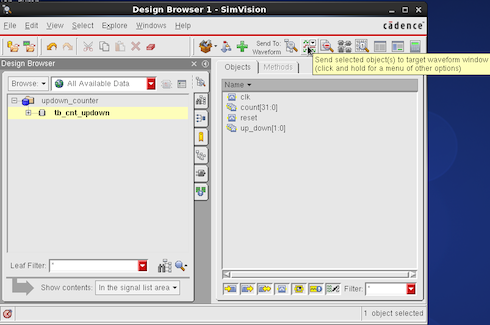
iv. Step iii. Will cause various signal to open. Select the ‘tb_cnt_updown’ in the design browser and then hit the waveform button as shown in fig. 7
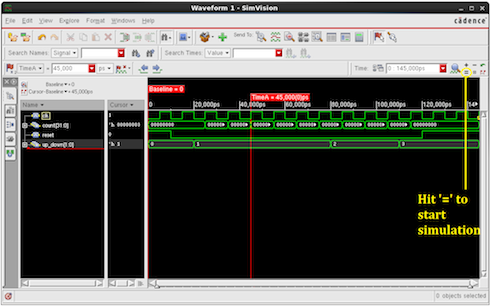
v. Next a waveform window as shown below in fig. 8 would appear.
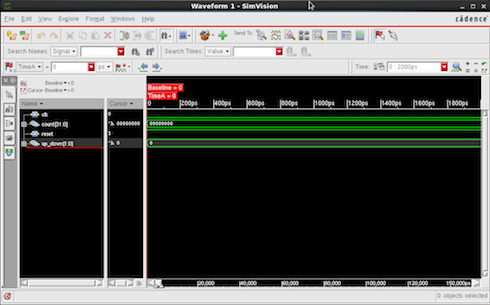
vi. Hit ‘=’ sign next to the simulation time frame to simulate and observe values.
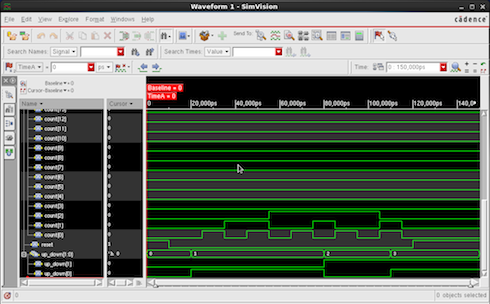
vii. On hitting ‘+’ sign next to signal name, the expanded waveforms can be observed
One can alter the test bench to check the different values of output signals. Simulation time can also be changed. Once the functionality is verified, exit the tool.
Comments to: ha@vt.edu

MICS IAP Members